Midlands 16K EV Charger Installation: A Technical Blueprint
The government’s recent announcement of 16,000 new electric vehicle chargers for the Midlands, backed by £40.8 million in funding, represents one of the UK’s most ambitious regional EV infrastructure expansions to date.
While this initiative promises to more than double its charging accessibility, it also requires a deep, technical understanding.
As EV charging infrastructure specialists, this is exactly the kind of expertise Versinetic can provide to ensure the maximum degree of success. This analysis helps determine how this transformative, ambitious rollout can deliver its intentions for drivers, businesses, and the broader energy ecosystem across the Midlands.
Grid Load Estimates
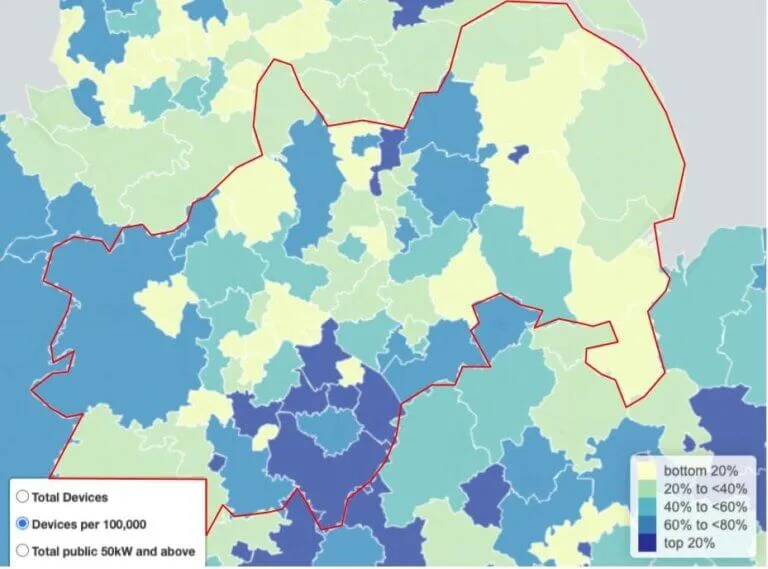
The Midlands represents 20% of the UK’s population, encompassing about 64 councils. Public EV charger distribution varies wildly across its councils, from North-East Derbyshire with just 21 chargers to Coventry City with an impressive 638 per 100,000 people (though the median is just 64). That represents a total of 13,000 chargers.
The first question is, therefore, where should new chargers be deployed?
Governments have different objectives from commercial suppliers, who need to return a profit as quickly as possible; they need to provide chargers where they can generate the best contribution to the EV transformation and net zero.
So, should the government place chargers in areas that are under-represented in order to boost EV take-up and the EV economy or place chargers in areas where there’s a lack of off-street parking to provide accessibility? If it’s the former, then they’re likely to be placed in more rural areas (for example, national parks or villages); if it’s the latter, then they’re likely to be placed in dense but poorer urban areas.
All of these kinds of decisions affect the likely grid load on existing substation locations. They would not, however, affect the likely grid load now, even if all the chargers were deployed tomorrow, because the public charger power requirements are dependent on the distance travelled by EVs, not the number of available chargers.
Instead, it’s better to start by working out the likely power requirements needed from the likely number of EVs in the Midlands in the coming years.
As of March 2025, UK (full) BEV sales totalled 1.36 million. The UK’s ZEV mandate says how many we expect through 2035 [1]. It’s not necessary to model that far ahead; what’s required is to determine when the additional 16,000 chargers will be likely as used as the current 13,000 are.
That will happen when we have (16,000+13,000)/13,000=2.23 as many EVs on Midlands roads as now, and there are approximately 1.36m*20%=272k BEVs currently, with about 2 million x 20% new cars = 400K added to Midlands’ roads each year.
Year | ZEV | NewEVs | Total |
|---|---|---|---|
2025 | 28% | 112K | 384K |
2026 | 33% | 132K | 516K |
2027 | 38% | 152K | 668K |
2028 | 52% | 208K | 876K |
So, this could happen when there are 606,000 BEVs on Midlands’ roads in late spring, 2027. Here, domestic and additional public commercial chargers are ignored; instead, the model substitutes government public chargers for them because the goal here is to figure out when an additional 16K public chargers will have the same usage.
It’s then fairly easy to work out the additional power requirements simply by knowing the average number of miles driven by a car in the UK per year, which is currently about 7600 miles [2]. At an average of 3.8 miles/kWh, that means (606k cars – the current 272k cars) x 7600 mi ÷ 3.8 miles/kWh = 668 GWh per year, or 668/(365.24 x 24) = a sustained 76 MW.
This is surprisingly small. The Midlands likely uses 20% of the UK’s current 30 GW at any one point, which is 6GW, so 76MW represents 1.3% of current power usage. In practice, it’s somewhat more because BEVs will likely charge at night (at home or on the street), during the day (at work), or en route during a long journey. This means it’s reasonable to assume about 16 hours rather than 24 hours available for charging, raising the average power consumption to 1.9% above current usage.
Increasing the Midlands’ electric power capability by 1.9% within 2.5 years should be possible (it’s only 0.95% per year). Yet, even this only represents the total power consumption, not the power usage from public chargers, which could be substantially lower.
At the same time, it fails to cover Rapid charging cases, which will generate high current consumptions.
Which EV Chargers Does The Initiative Fund?
The government initiative will comprise some proportion of rapid (50kW+) DC chargers and fast (7kW+) AC chargers.
Commercial AC charger installation costs currently range from £1000 to £1500 per charge point[3], after which a £350 government grant can be applied. Since that won’t apply to this £40.8m investment, here it will be assumed that it’s £1000+£350 = £1350/installation point (though we should consider that the scheme is for 16,000 charging sockets, where each AC charger provides 2 sockets, as this is only marginally more expensive).
DC Rapid chargers, on the other hand, are much more expensive, easily costing £25K per installation [4].
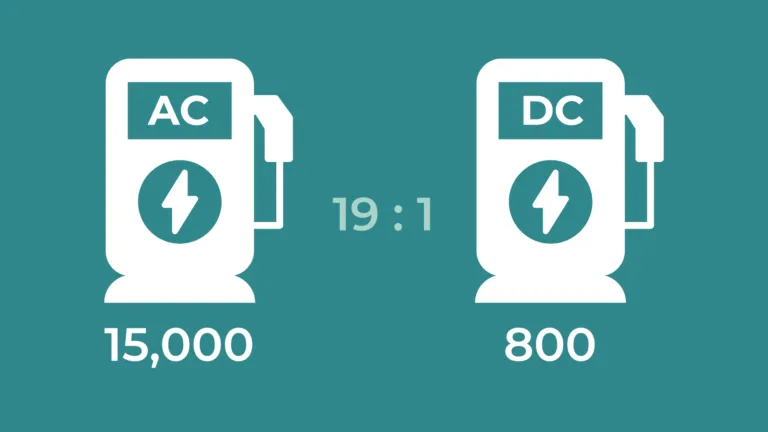
Since 16,000 x £1350 is only £21.6m (and closer to £11m if it’s two-socket chargers), it means at least half the money must be spent on rapid DC chargers too. Some simple maths leads to:
Case\Chargers | AC Chargers | DC Chargers | AC/DC Ratio |
|---|---|---|---|
1 Socket Per AC Charger | ≈15000 | ≈800 | 19:1 |
2 Sockets Per AC Charger | ≈7400 | ≈1200 | 6:1 |
Government could, of course, make different trade-offs with the number of chargers, if it wanted to prioritise AC chargers for on-street charging, up to 30,000 chargers; or (mostly) DC chargers for en-route charging, up to 1,632 DC chargers. These priorities depend upon the likely usage.
Current Public Charger Usage
Unlike combustion car refuelling, most EV charging takes place at home through off-street, domestic charging. Versinetic has previously covered some of the needs and expectations for the full roll-out of charging, given that 40% of households in the UK have no off-street charging capability.
In summary, it’s not the immediate issue it appears to be because there are multiple mechanisms for providing charging to these households because far fewer of these households have occupants who can drive. Finally, EV early adoption is heavily skewed towards wealthier homeowners who typically have multiple cars, all of which get switched once they see the benefits after their first EV.
Nevertheless, towards the end of this decade, the need to provide access for all kinds of households becomes more important, especially for London or the large Midlands conurbations from Birmingham to Nottingham.
Therefore, it helps to know how much current EV users spend on both destination and en-route public chargers.
UK public EV infrastructure and payment systems report available now

A simple Facebook survey reveals that EV owners use public charging about 18% of the time (sample size 31). The sample size is small, but it reveals a few important trends:
Frequency\Type | Average | EnRoute | Contribution | Destination | Contribution |
|---|---|---|---|---|---|
≥66% | 83% | 6% | 5% | 6% | 5% |
33% to 66% | 50% | 1% | 0% | 1% | 0% |
10% to 33% | 22% | 16% | 3% | 0% | 0% |
≤10% | 5% | 54% | 3% | 16% | 1% |
TOTAL: | 12% | TOTAL: | 6% | ||
GRAND TOTAL: | 18% |
A key observation is that en-route public charging is used twice as much (12%) as destination charging (6%). This is because most current EVs have high, 200mi ranges, and most EV owners can charge off-street.
The second key observation is that usage follows an inverted normal curve, biased to infrequent use of public charging for both en-route and destination charging. A roughly equal but small group of users frequently use en-route charging and/or destination charging. The majority of users use en-route charging less than 10% of the time, and also the largest, but still small, group of users use destination charging less than 10% of the time.
By themselves, these observations suggest that it would be better for the government for this round of EV charger roll-out to favour en-route chargers over destination chargers, even though that will mean providing fewer chargers in total. For example, if the government chose to provide chargers at a ratio of 2x DC chargers to 1x AC charger (but 2x AC sockets), then it would end up supplying a mere 1677 DC chargers and 1677 AC chargers (3354 sockets). Politically, though, that’s challenging because the total charging facilities would be <1/3 of the current plan.
A deeper question, though, is whether, regardless of the balance of public chargers the government is providing, it is anywhere near enough. After all, we expect 500,000 new EVs in the Midlands by 2028, but this initiative intends to provide 16,000 chargers.
It’s possible to work out how many EVs 16000 x 7.3 kW public destination chargers can support from average travel requirements and charger availability, assuming chargers are placed optimally at workplaces and on streets. An average UK car travels about 7600 miles per year [6], and an EV, on average, travels about 3.8 miles per kWh. Therefore, an average EV will use about 2011.7 kWh/year, which is, on average, 229 W. If we assume that a single 7.3 kW could be utilised 100% of the time (with some logistical planning), then it can support about 32 EVs.
In other words, 16,000 x 7.3 kW chargers can support a maximum of over 500,000 EVs. That’s a little more than all the EVs expected in the Midlands between now and 2028. If these chargers were used to provide charging facilities for communities or streets that lack off-street parking, then they can provide charging facilities for up to 500,000 ÷ 0.4 = 1.25 million EVs. The 15,000 AC chargers in scenario 1 provide for 1.2 million EVs. That’s another 3 years or so (to 2031).
En-route DC chargers are a different matter: although they charge more quickly, they’re most likely to be used during peak journey times rather than at other times of the day or night. For example, far fewer people travel long journeys after 8 pm and before 6 am, but long journeys are common in the mornings, at lunchtime and in the evenings.
If we therefore assume 100% utilisation is possible for about 3 hours in each of these periods and 10% utilisation elsewhere, then a single 100 kW charger can provide for 100 kW x 3 hours x 3 periods x 100% + 100 kW x (24-9) x 10% = 90 0kWh + 150 kWh = 1050 kWh per day or an average of 43 kW; so a single such charger can support 191 EVs.
In other words, the 1200 DC chargers in case 2 can support about 229,000 EVs. If all of the money was used for DC chargers, providing 1600 DC chargers, this amounts to 312000 EVs, about half the expected number of EVs.
What this means is that DC chargers are a poor use for primary EV charging but a good use for en-route charging. To illustrate, if 800 DC chargers are used for en-route charging, then they are required for only 20% of charging scenarios; thus, they support 5x the number of EVs: 800 x 191 x 5 = 764K EVs, far more than the expected growth of EVs across the Midlands.
Load Management
The 16,000 chargers represent a small amount of the Midlands’ overall electricity usage, but localised load can be much more variable, and grid capacity requirements are more than just the Government’s chargers; they’re the total requirements for all the expected EVs in the Midlands.
Furthermore, the government may benefit by planning for long-term change rather than having to upgrade equipment repeatedly over the coming decades.
The ZEV mandate extends beyond 2028 to 2035, when the new EV market is expected to be 100% of the car market. In addition, light vans, all buses and increasingly HGVs will become fully electrified, and in time, all vehicles on the road will transition.
If the ZEV table for cars is continued through to 2050 at 5-year intervals:
Year | ZEV | New EVs For 5-year Period | Retired EVs (>14 Years old) | Total | Optimal Grid Requirements (MW) | Optimal Grid Requirements (%) |
|---|---|---|---|---|---|---|
2025 | 28% | 559K | 218 | 600K | 134MW | 2.2% |
2030 | 80% | 1188K | 6K | 1782K | 408MW | 6.4% |
2035 | 100% | 2160K | 270K | 3672K | 841MW | 12.3% |
2040 | 100% | 2400K | 475K | 5597K | 1282MW | 17.6% |
2045 | 100% | 2400K | 1412K | 6585K | 1508MW | 20.1% |
2050 | 100% | 2400K | 2240K | 6585K | 1508MW | 20.1% |
Ideal load balancing means that grid requirements will increase by about 20.1% due to EVs in the region. Nevertheless, electricity usage is expected to grow by a factor of 2 by 2050, according to Dr James Richardson, Chief Economist at the Climate Change Committee [7].
The critical issue, as pointed out in the podcast, isn’t whether we can generate enough electricity; we can. We doubled the amount of electricity generation during the 1950s under an economic climate of severe austerity; it’s far easier for us to do it again.
Besides, the UK gains in electrifying everything result in an economic benefit, both from efficiency gains (electric power is about 3x more efficient than fossil fuels) and also because renewable energy is getting cheaper, currently by about 15% per year [8].
Yet, these economic benefits can only be realised by distributing load effectively under a dynamically shifting environment and infrastructure. These steps involve:
Identifying critical bottlenecks, that is substations or cables which are closest to exceeding their power requirements.
Upgrading in one step for substations and distributors so that the grid doesn’t have to be upgraded multiple times by 2050.
Focussing development on localities which can benefit the most and/or have the most immediate capacity.
Making the best use of local power generation (such as Solar PV or wind) or supply (such as Vehicle To Grid (V2G)) in order to reduce substation load. This aspect is starting to gain recognition for the increasing, though still few, periods when local power generation exceeds local power requirements, forcing power back up the grid. That is where a substation delivers negative power, not something considered given development in an era of large, centralised power stations.
Load balancing, and more extensively, Automatic Demand Response, see the Versinetic™ article [9]. ADR, in particular, through simple, dynamic generation and loading messaging protocols, has the potential to balance loads intelligently at every scale of the power network.
Linking charging to load balancing, for example, directing en-route EVs to charge via under-utilised rapid charging points.
Voltage Stability
A single Rapid DC Charger can draw 50 kW to an increasingly common 150 kW with 350 kW+ on the horizon, and banks of 2 or more are frequently installed.
This is a substantial proportion or the same as a standard UK substation and can cause voltage sags, particularly for areas with high resistance to inductive loads [10], potentially leading to a cascading overload.
Addressing this involves analysing the Voltage Sensitivity Factor [11], the ratio of ∆Voltage to Active Power.
The Optimal Charging Mix
AC charging placements in urban areas can implement close to 100% of the optimal destination charging requirements, and destination chargers at popular locations (such as pubs, entertainment venues, parks, and National Trust or English Heritage sites) help reduce the need for en-route DC charging and smooth out power requirements.
Combining traffic flow analysis [11] with power delivery is essential for the placement of DC chargers for the same purposes.
Regulations
Regulations are required for interoperability, industry confidence, safety and future planning. EV Charging regulations already provide ample support for nearly everything covered earlier:
Standard | Purpose |
|---|---|
IEC 61851 | AC Charging points. |
IEC 61008-1 & 62423 | Residual Current Device (RCD) for safety. |
MID | Measuring Instruments Directive (MID) allows SolarPV and EV Charge generation to be measured and reported. |
IEC 62955, 60947-2, 60947-6-2, 61009-1, 60898, 60269. | RCD overcurrent and transient regulations for public areas with unrestricted access while limiting fault cascading. |
ISO 15118 | Smart, Plug & Charge charging, V2H (home) and V2G (Grid)[13]. |
The Back-End : User Interfaces
For an effective transition to EVs, regulations should also cover user interfaces and payment mechanisms for public chargers. At the moment, both device and smartphone app UIs have a multiplicity of mechanisms and interfaces. Personal data must be repeatedly entered just to pay for charging.
Operational sequences are unintuitive, diverse and sometimes conflict – in that some chargers require you to plug in first, then connect via the app; others require the reverse operation; some require the user to follow on-screen instructions and finally connect; others have LEDs but no screen to follow; and some even require users to return to the screen after an apparent connection to confirm charging.
Generally speaking, users would prefer no more than one app to cover all possible charger companies, and customer support should be available 24/7.
Some progress has been made in contactless payment, and this should be expected for this initiative.
Networks
At the most basic level, chargers should be capable of communicating via cabled Ethernet, Wi-Fi, and, if local networks fail, 4G+ mobile networks.
For example, it is unacceptable for underground car park chargers to expect users to download an app to charge when no 4G+ networking is available. Furthermore, if all the networking fails, but the charger is still capable of charging a vehicle, it should allow charging, recording debit card payments for when a link is re-established.
To support all of this, comprehensive fault detection is required both at the charger end and the service provider end.
Midlands 16K EV Charger Installation: Summary
The government’s 16,000 EV charger installation rollout for the Midlands is welcome and entirely feasible.
After more than a decade of EV and public charger development, the technology is becoming mainstream, regulations and standards are virtually complete, and development and installations are well understood at a practical level.
Government power should enable chargers to be placed where they can have the most impact and address often ill-founded public concerns. The initiative itself should accelerate EV adoption within the Midlands but also help lay the groundwork for grid and power generation upgrades for decades to come.
In the end, its ambition helps complete the package for the clean energy transition: the five-year carbon budget mandates, the potential of renewables, the commitment to net zero and the ZEV objectives.
FAQs
The government initiative will include a mix of rapid (50kW+) DC chargers and fast (7kW+) AC chargers. Based on the £40.8 million funding allocation, we can expect approximately 800-1200 DC rapid chargers with the remainder being AC chargers. This balance aims to serve both destination charging needs (primarily through AC chargers) and en-route charging requirements (through strategically placed DC rapid chargers).
The additional power requirements from 16,000 new chargers represent only about 1.9% of the Midlands’ current power usage. While this is manageable for the overall grid, localised load management will be critical. The deployment will require careful assessment of grid capacity across diverse locations, voltage stability monitoring, and implementation of load balancing systems to prevent localised grid strain. Long-term planning should consider that by 2050, EVs could increase regional electricity requirements by approximately 20%.
All charging units must comply with relevant standards including the IEC 61851 series for charging stations and appropriate safety compliance for Residual Current Devices (RCDs) under standards like IEC 61008-1 or IEC 62423. Additional requirements include robust metering systems compliant with Measuring Instruments Directive (MID), comprehensive overcurrent protection, and appropriate user interfaces. The deployment should also consider future compatibility with Vehicle-to-Grid (V2G) technology through standards like ISO 15118.
The government will need to balance placing chargers in under-represented areas to boost EV adoption versus focusing on areas lacking off-street parking to improve accessibility. The most effective strategy will likely involve placing AC chargers in residential areas without off-street parking and concentrating DC rapid chargers along major transport corridors. This approach maximises infrastructure utilisation while addressing the needs of both current and future EV owners.
References
[1] https://www.evaengland.org.uk/our-work/zev-mandate/
[2] https://roadtraffic.dft.gov.uk/summary
[3] https://www.spiritenergy.co.uk/kb-ev-charging-point-business-case
[4] https://info.chargepoint.com/alpitronic-hypercharger-promo-en-gb.html
[5] https://www.facebook.com/groups/ukelectricvehicleowners/posts/4712741945618290
[7] https://youtu.be/UYhPBr-g-6I
[8] https://ourworldindata.org/grapher/levelized-cost-of-energy
[9] Automated Demand Response article by Versinetic™.
[10] https://uk.farnell.com/the-effects-of-electric-vehicle-charging-on-the-power-grid-trc-ar
[11] https://www.tomtom.com/traffic-index/birmingham-traffic/
[12] https://www.capture.energy/blog/vehicle-to-grid-uk-v2g-when-can-my-ev-power-my-home
[13] https://cleantechnica.com/2019/05/05/the-innerworkings-of-plugcharge-using-iso-15118/

Julian Skidmore is Versinetic’s EV Industry Analyst.
He has a Computer Science degree from UEA and an MPhil in Computer Architecture from Manchester University, as well as over 20 years of experience in embedded systems development.
As a senior software engineer, Julian has worked on EV charging and V2G projects, and has also co-authored EV-related articles for the electronics industry press.
Julian is a proponent of the zero-carbon society and a Guardian News ‘climate hero’. He has owned a battery EV for over two years, has investments in wind farm cooperatives, and has a 4KW domestic solar PV installation.